These are a selection of projects that I enjoyed working on over the years. Head over to my github if you want to take a look!

RD Pass - Password Manager Application

Cross-platform password manager with GUI using Python Kivy

Python

Kivy

SQL


UI design

Database management

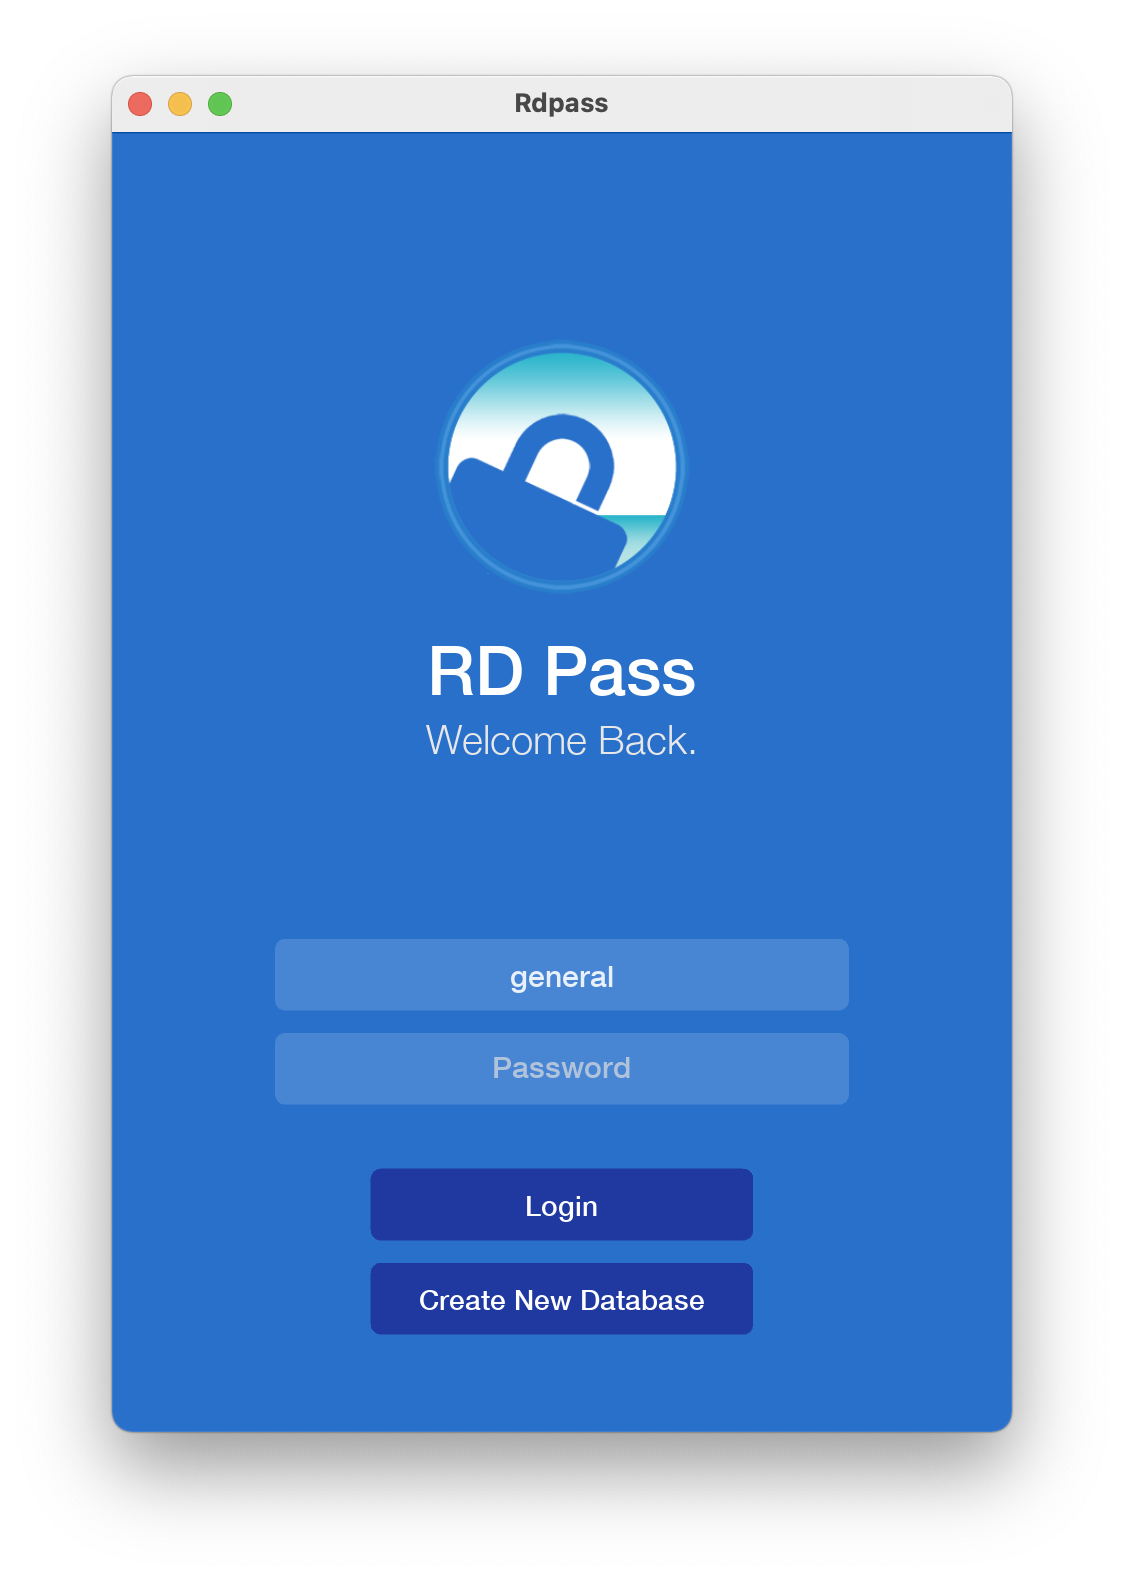
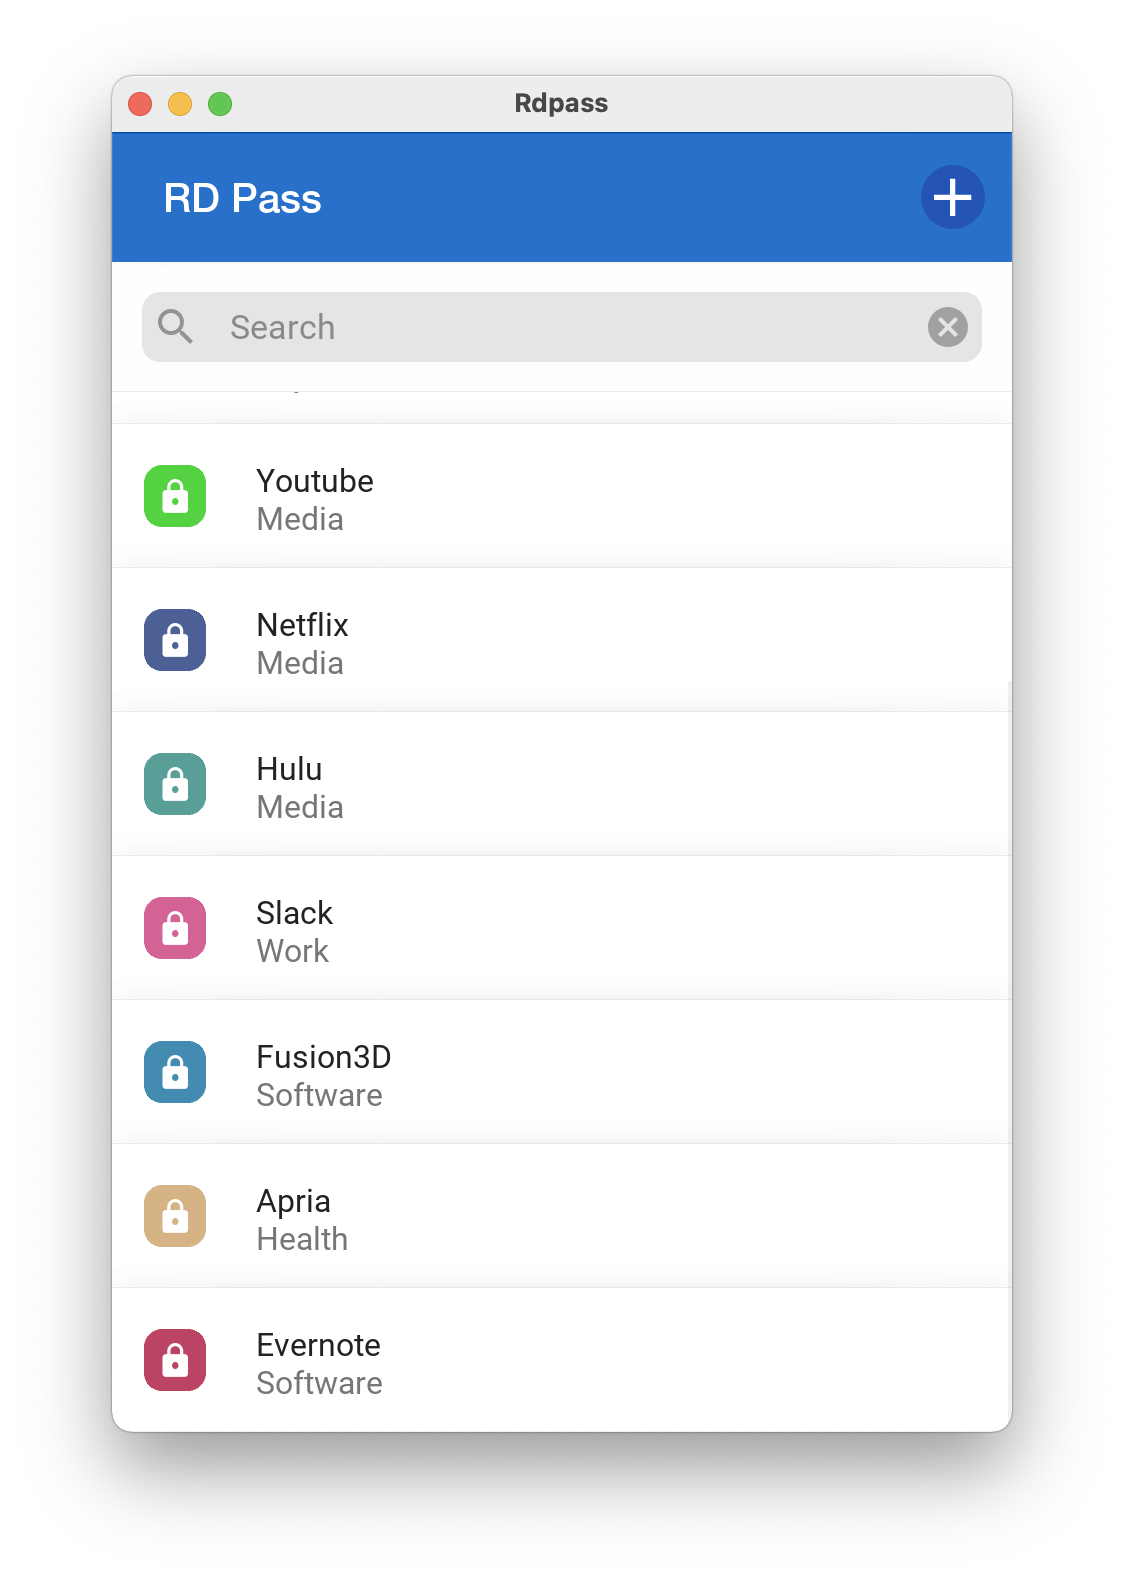
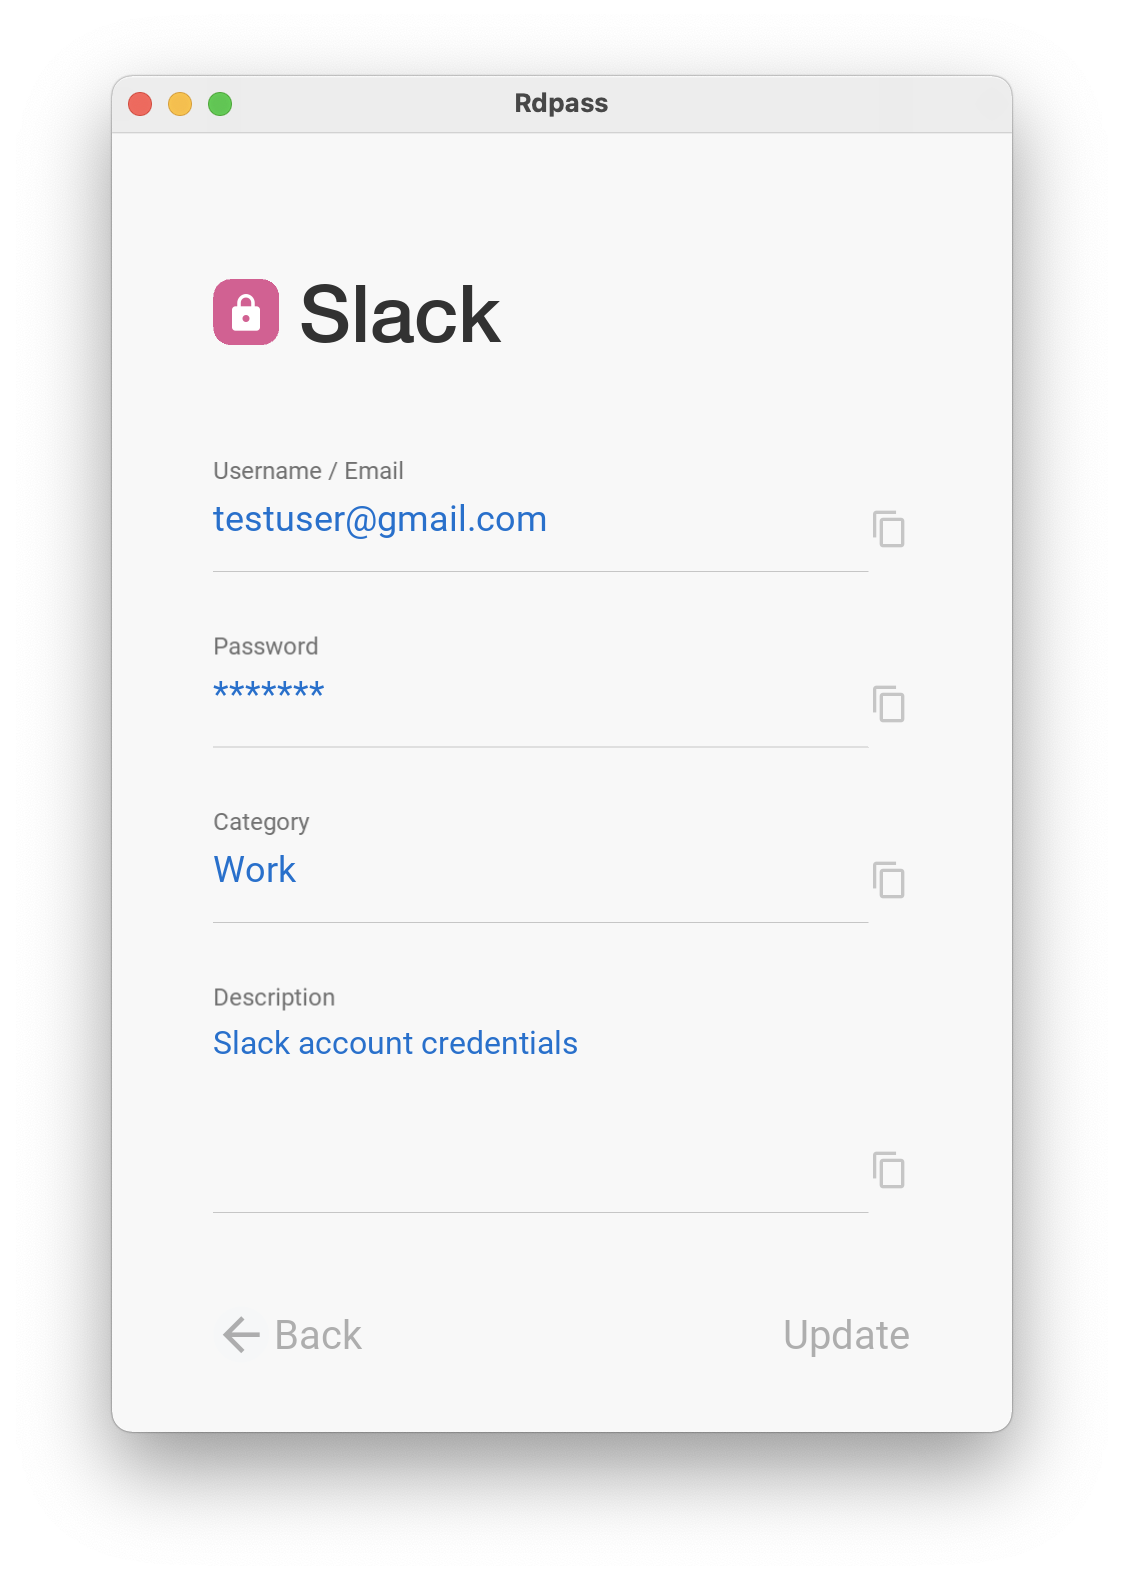
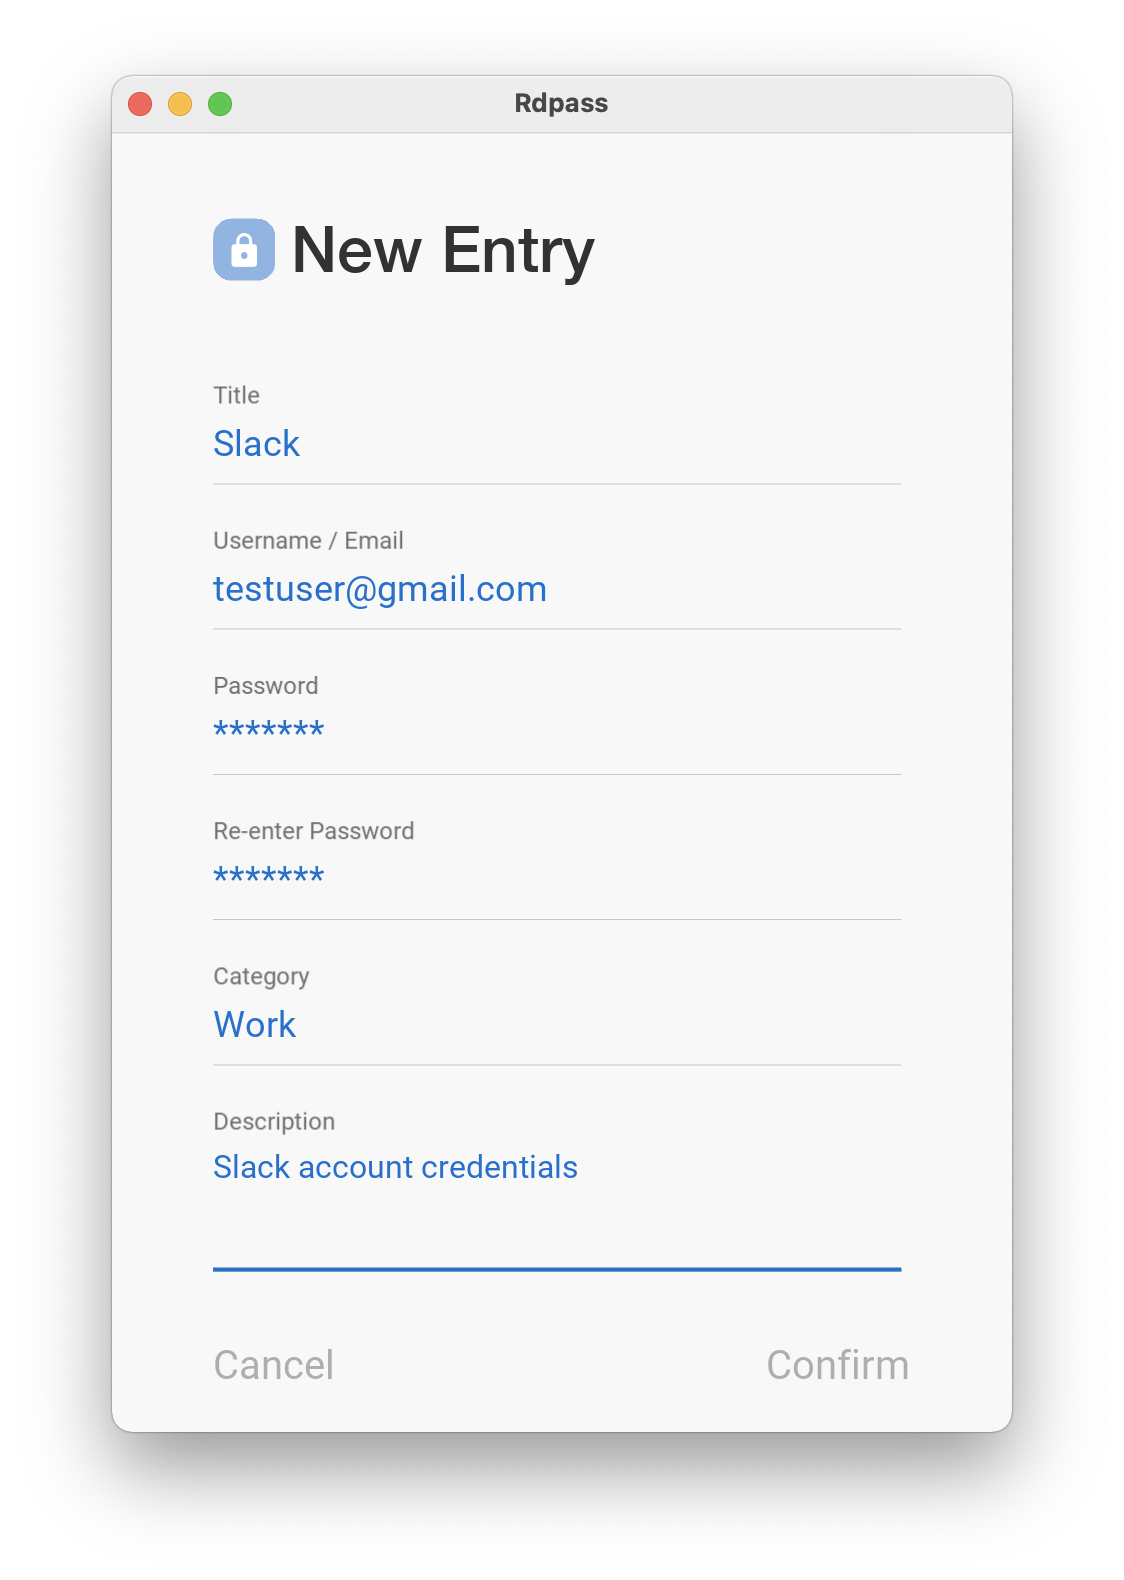
RD-Pass is a password manager application developed using the Python Kivy framework. It uses databases to store the credential entries with AES encryption. It supports features such as multiple database management for different groups of passwords, a search bar to query both the category and title of the entries, one-button copy to clipboard etc. The repo for both the GUI and command-line versions of RD-Pass are available on my GitHub.

Why RD Pass?

In the last few years I started losing track of my login credentials to different websites and servers. Since many of those are not for websites (e.g. login credentials for remote servers and applications, passwords for my backups), browser-based password managers weren't sufficient. I needed a standalone password manager application that I can trust, does not store passwords online, and can be launched quickly. I developed the text-based version of RD-Pass, but quickly realized it needed a GUI to be usable. I came across the Python library Kivy, a cross-platform for application developement. With its flexible and agile UI design using the Kv langauage, I created a graphical user interface for RD-Pass, which I now use daily. RD-Pass can be used on Mac OSX, Linux, Windows, and iOS and Android devices after packaging.

Example screenshots of RD-Pass

Daily Stock Market Analysis Report Dashboard

Web-based data visualization of daily market breadth and selected stocks

Python

Plotly/Dash

CSS

Cron


Data Analysis

Data Visualization

This web-based dashboard displays a daily US stock market analysis report compiled by my Stock-vcpscreener package, a Python stock screener that calculates various market breadth indicators and selects US stocks on a daily basis based on multiple criteria. The criteria are applied to the simple moving averages and price performance of the stocks over the last year. The goal is to look for a volatility contraction pattern in the market, a specific chart pattern that suggests the stock may move into an uptrend in the near future. The dashboard was created using Plotly Dash. Currently, the Dash app is hosted on https://jeffreyrdcs.pythonanywhere.com and https://stock-vcp-dash.herokuapp.com (now defunct). A scheduled cron job is run every weekday at 2 am UK time to update the dashboard with the latest report. The source code for stock-vcpscreener and the Dash app is available on my Github.

Why a stock screener?

This project started off as a code refactoring practice exercise based on a command-line stock screener I read about on an online forum. After I finished refactoring the code, I thought it was a good idea to develop a visualization application to keep track of the results every day. I chose the Plotly Dash framework because it was suitable for creating high-level interactive web-based dashboards. Other possible options include Streamlit, Tableau and Shiny (in R), but I found Dash more adaptable.

Example screenshots of the Dash application. See it in action here!
Contact