My research centers on exploring the formation and evolution of galaxies, which is one of the long-standing problems and active research fields in astronomy.

Over the last decade, galaxy properties have been explored in increasing detail to higher and higher redshifts (further backwards in time), thanks to various technological advancements. This allows us to study the progenitors of the local galaxy population directly and compare with what we found from fossil records in local galaxies.

We know that galaxies evolve. Using both space and ground-based observations, I try to find out how the properties of the galaxy population, such as the abundances, morphologies and structural properties, change over time, where these changes preferentially happen and why they occur.

An excess of quiescent disky galaxies in high-redshift clusters

The GOGREEN Survey: Evidence of an excess of quiescent disks in clusters at 1.0<z<1.4

It is well-established that the environment of a galaxy plays a crucial role in its evolution. In the local universe, galaxies in galaxy clusters are mainly red and no longer forming stars. They have early-type morphologies (a way of saying they are approximately ellipsoidal), which is very different from the disky late-type morphology that star-forming galaxies, like our Milky way, have. This implies a morphological change must have taken place at some point in their lifetime. Understanding when and what drives this morphological transformation is an important question in galaxy evolution.

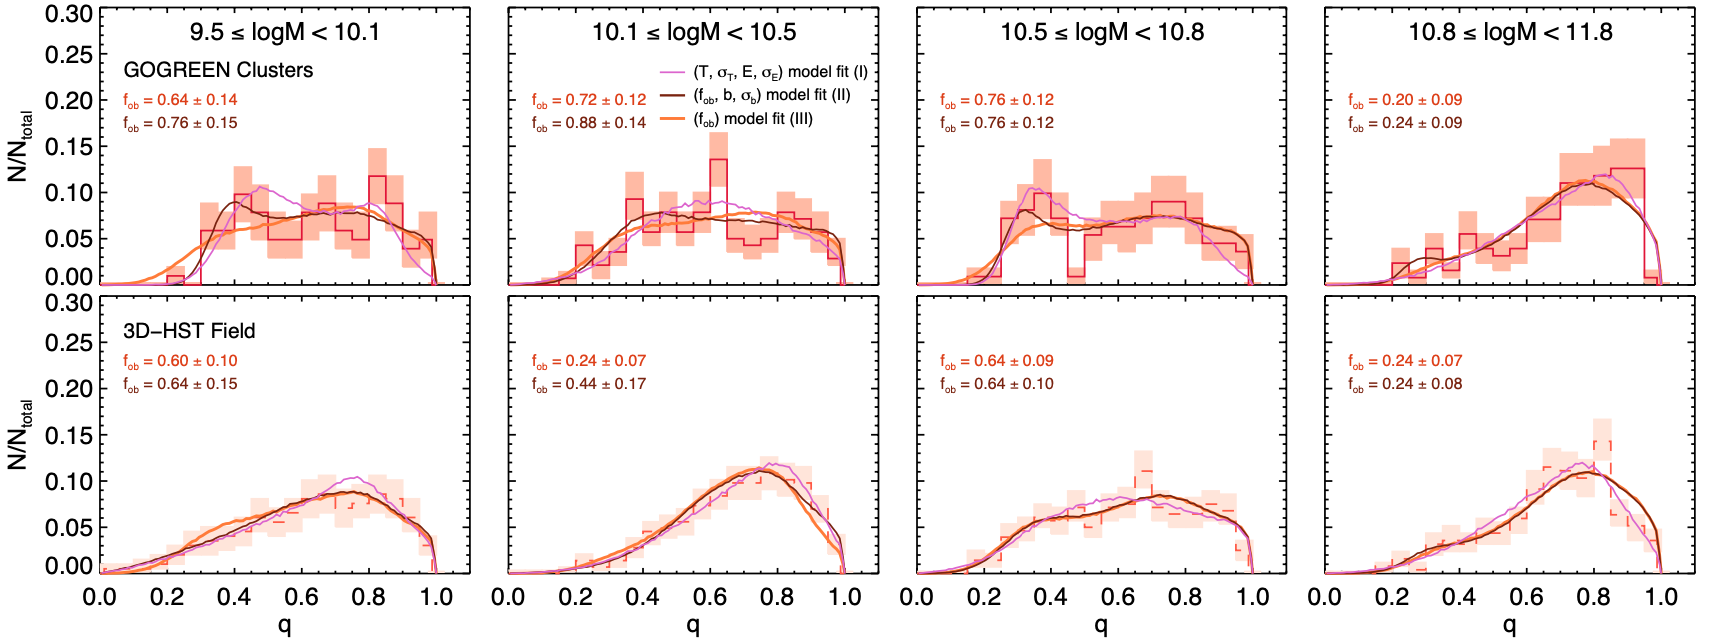
In a study I led in 2021 as part of the Gemini Observation of Galaxies in Rich Early Environments (GOGREEN) survey, I measured the projected axis ratio (the ratio of the minor to the major axis) of cluster galaxies in a sample of galaxy clusters at 1.0<z<1.4 and compared them with a sample of galaxies in the field. Comparing the axis ratio distributions between clusters and the field in four mass bins, the distributions for star-forming galaxies in clusters are consistent with those in the field. But interestingly, the distributions for quiescent galaxies in the two environments are distinct, most remarkably in 10.1<log(M_sun)<10.5 where clusters show a flatter distribution, with an excess at low axis ratios.

Modelling the distribution with oblate and triaxial components, we find that the cluster and field sample difference is consistent with an excess of flattened oblate quiescent galaxies in clusters. The oblate population contribution drops at high masses, resulting in a narrower q distribution in the massive population than at lower masses. Our results suggest that environmental quenching mechanism(s) likely produce a population with a different morphological mix than those resulting from the dominant quenching mechanism in the field.


Deficit of faint red-sequence galaxies in high-redshift clusters

The rest-frame H-band luminosity function of red-sequence galxies in GOGREEN clusters at 1.0<z<1.3

In the local universe, the galaxy population in the high-density environment (galaxy clusters and groups) comprises mainly red, passive galaxies that are no longer actively forming stars. The red galaxies in the highest-density environment, i.e., galaxy clusters, reside in a distinct region of the color–magnitude space known as the red sequence. Understanding how these red-sequence galaxies form and evolve and the physical processes involved remains one of the primary goals in extragalactic astronomy.

The extent of the evolution of the faint red-sequence population is under debate. Various studies have revealed that clusters at intermediate and high redshifts show a continual decrease in the fraction of the faint red-sequence population with redshift, which indicates a gradual buildup of the faint red-sequence population over time. Contrary to the studies mentioned above, several studies have reported that there is little or no evolution of the faint end of the red-sequence cluster luminosity function up to redshift z~1.5, which in turn suggests an early formation.

In a study I led in 2019, I investigated the abundance of faint red-sequence galaxies in a sample of galaxy clusters taken from the Gemini Observation of Galaxies in Rich Early Environments (GOGREEN) survey at 1.0<z<1.3. By looking into the rest-frame H-band luminosity function of the clusters, we showed that there is a deficit of faint red-sequence galaxies in clusters at 1.0<z<1.3. By comparing our sample with a sample of clusters at z~0.6, we find an evolution of the faint end of the red sequence over the ∼2.6 Gyr between the two samples, with the mean faint-end red-sequence luminosity growing by more than a factor of 2. The ratio of faint to luminous red sequence galaxies (faint-to-luminous ratio) of our sample is consistent with the trend of decreasing ratio with increasing redshift proposed in previous studies. We also found that the faint-to-luminous ratios in clusters are consistent with those in the field at z~1.15 and exhibit a stronger redshift dependence. Our results support the picture that the buildup of faint red-sequence galaxies occurs gradually over time and suggest that faint cluster galaxies, similar to bright cluster galaxies, already experience the quenching effect induced by the environment at z~1.15.


Structural properties of passive galaxies

From luminosity-weighted to mass-weighted structural parameters

Massive passive galaxies at high redshift appear to be extremely compact in size. Those at z~2 have sizes three to four times smaller than their counterpart with a similar mass in the local Universe, suggesting a size evolution over cosmic time. The exact degree of the evolution and the role of the environment to galaxy size are not yet clear. Studies at high-z often show conflicting results.

Size measurements are mostly derived from 2D parametric fitting (e.g. Sérsic profiles) of the galaxy surface brightness profiles from imaging data, i.e. luminosity-weighted. At high-z, the star formation history and stellar population gradients of the galaxies play a huge role in their internal color gradients and luminosity-weighted sizes, making luminosity-weighted sizes not always a reliable proxy of the mass distribution of galaxies.

I therefore developed a novel technique to derive 2D spatially resolved stellar mass maps and mass-weighted sizes for galaxies. Stellar masses can be derived either through spectral energy distribution (SED) fitting techniques or through relations between the stellar mass-to-light ratio (M/L) and color. Following the latter, I exploit the high-resolution imaging and an M/L-color relation, calibrated using public survey catalogues. This allowed me to study the mass distribution and derive mass-weighted structural parameters of the galaxies via parametric fitting. This method, described in detail in my 2016 work, has the advantage of obtaining mass-weighted sizes for a large sample of galaxies with the sole requirement of a suitable combination of imaging and M/L-color relation.

In my 2018 work, we applied this method to a sample of passive galaxies residing in high redshift galaxy clusters at redshift z~1.5 from the KMOS Cluster Survey (KCS) and showed that their mass-weighted sizes are smaller than their luminosity-weighted sizes measured in rest-frame R-band. The average mass-weighted size to luminosity-weighted size ratio (size ratio) that varies between ~0.45 and 0.8 among the clusters. Comparing the size ratio with those in local galaxies and those in field galaxies at a similar redshift, we found that this ratio depends on the environment where the galaxies reside. The average ratio is larger in galaxies residing in more evolved clusters in our sample, showing that these galaxies experience environmental effects that can alter their internal M/L gradients.


Color gradients and stellar population properties of passive galaxies

Examples of colour profile fitting of four passive galaxies in the cluster XMMUJ2235-2557.

Color gradients and color profiles in massive passive galaxies provide valuable information on their stellar properties for disentangling the underlying physical mechanisms of galaxy formation. In the local Universe, massive passive galaxies are found to have negative optical color gradients, in the sense that they have redder colors in the core compared to the outskirts. The color gradients are mainly due to radial variation of stellar metallicity within the galaxies. Measuring the color gradients at high redshift galaxies is more challenging due to compact sizes and limitations on instrumental resolution.

In my 2016 work, I investigated the color gradients in the passive galaxies in the high redshift cluster XMMUJ2235-2557 in rest-frame U-R color. I discovered that the color gradients in these galaxies are extremely steep. The median slope is a factor of two steeper than what we have seen in local passive galaxies.

To understand the origin of these color gradients and their evolution, the color gradients were modeled under different assumptions in the radial variation of stellar population properties. We showed that the color gradient evolution is mainly caused by an evolution in age gradients, while the survival of weaker color gradients in local passive galaxies implies that metallicity gradients are also required. Such age gradients can only be seen at high redshift, as the effect of such gradient in color will gradually reduce over time and become harder and harder to be detected in local galaxies. Our findings are consistent with the scenario where passive galaxies grow inside-out; Cores were formed at an earlier time than the outskirt (inside-out growth). This favors a gradual mass growth mechanism.


Kinematics of the optical emission-line nebula in NGC 1275

PMAS/PPAK intergral field spectroscopy observation of NGC 1275

Kinematics map of optical nebula of NGC 1275. Left: Line-of-sight kinematics map obtained from line fitting (in kms-1). Right: Hα image taken by the 3.5m WIYN telescope from Conselice et al. (2001).

Bright optical nebulae are a relatively common feature of local galaxy clusters with a central depression in their intracluster gas temperature (cool-core clusters). Popular models for the nature of the nebula invoke either an X-ray cooling flow or gas drawn out from the galaxy by radio-mode feedback from its active galactic nucleus (X-ray bubbles). One famous example of such optical nebula is the one associated with NGC 1275, the brightest central galaxy of the Perseus cluster. This nebula is the brightest example with the largest projected size in the sky, it spans up to ~140 kpc in the north-south direction, extending far beyond the half-light radius of the galaxy itself.

In my master project, I measured the velocity field of nearly the entire optical nebula of NGC 1275 using an integral field spectroscopy observations of NGC 1275 by the Potsdam Multi-Aperture Spectrophotometer (PMAS) in the PPAK mode installed at the 3.5m at the Calar Alto Observatory. We attempt to address the physical processes that give rise to the complex morphology of this nebula.

As one can see from the figure, we found that the velocity field of the nebula is incredibly complex, and in several important aspects contradicts model predictions based on previous slit spectroscopy. Filaments previously thought to be very long integral structures actually comprise multiple shorter threads that each have their own distinct kinematics. Filaments that are apparently aligned and adjacent to each other often possess entirely different kinematics. Both the morphology and kinematics is complicated by the action of multiple X-ray bubbles that are currently expanding or rising through the nebula. We found evidence from the observed kinematics supporting the idea that some filaments are being dragged by rising X-ray bubbles, others represent large-scale vortices behind bubbles, and yet others are draping the surface of and pushed outwards by expanding X-ray bubbles.

Contact